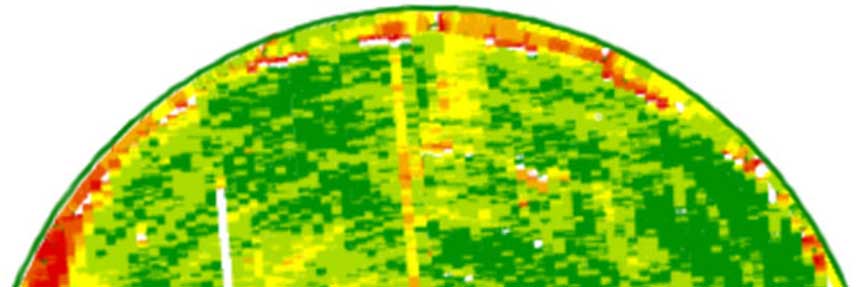
With the high costs of crop inputs, it is vital to ensure the inputs applied are necessary and beneficial. Yield mapping can provide the key to determining the effectiveness and efficiency of the inputs.
“Many producers have yield mapping capabilities but not all take advantage of the technology,” says Craig Koehn, Crop Quest Agronomist in the Montezuma, KS Division. Interpreting and utilizing the information is very simple when working with your Crop Quest Agronomist and Precision Ag Team. Simply give the card or jump drive to your agronomist -they will download the information and do the yield analysis for you.
“The possibilities are endless on what you can learn from yield monitoring. There is so much information gained and so many reasons why something is happening in a field,” explains Garet Havel, Crop Quest Agronomist in the Ulysses, KS Division. “If a producer is interested in why different parts of the field perform differently, this is a great management tool,” adds Havel.
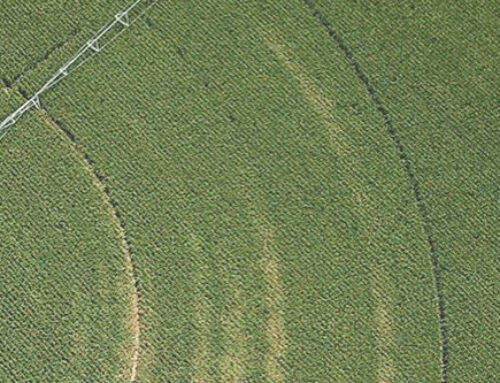
“One of the basic and most common uses for yield maps is to determine if and where irrigation sprinkler nozzle packages are working properly,” says Sam Turner, Crop Quest Agronomist in the Ulysses, KS Division. Turner also uses the information to determine management zones within a field. Soil samples are taken within the zones to determine fertilizer needs. Crop Quest works with both the producer and/or custom applicator to write a prescription for the fertilizer application.
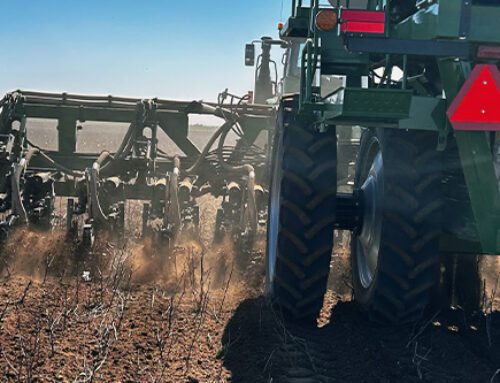
Koehn says he has used crop yield mapping to determine variable rate applications and to adjust seed population rates during planting. “When making fertilizer recommendations, we may decrease the amount of fertilizer to areas that consistently yield lower than average, while increasing the amount of fertilizer in higher yielding areas. If an area has been under-fertilized over several years (confirmed by soil testing), then we may increase our fertilizer recommendations in the lower yielding areas,” states Koehn.
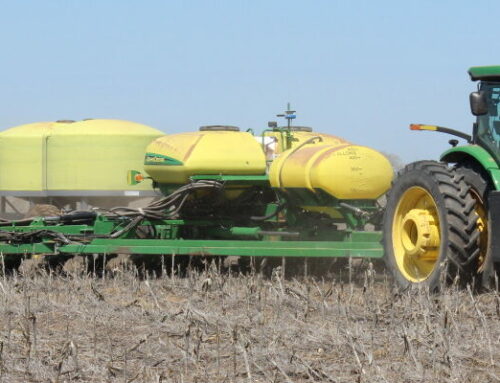
He continues “Likewise, we may increase seed population rates to increase yields in some areas while decreasing populations where conditions such as soil texture and slope warrant a different population. Over-population may occur in sandy soils. By varying plant population based on data, overall seed use can be decreased, and the corn should generally produce larger ears. In turn, this should then increase overall yield.”
“Comparing yield data over consecutive years shows soil type differences similar to those found when soil texture mapping,” states Havel. Some producers prefer to use a ‘blanket’ approach to fertilizing in order to increase yields. Yields may increase, but so does the input cost which decreases the bottom line. “Using yield maps for variable rate application decreases input costs while increasing yields which leads to higher profits,” emphasizes Havel. Crop yield mapping can also determine hybrid response in soil type and with the amount of water available per field.
Turner also recommends sharing yield data and maps with landlords. This type of information has also been shared with insurance companies for showing hail damage.
“Keep in mind that recommendations are a field by field decision as there is no consistent recommendation that will fit all fields in all circumstances,” concludes Koehn. Utilizing yield mapping for future management decisions can increase efficiency and profits. Contact a local Crop Quest Agronomist or visit our Yield Analysis page for more information on how technology can enhance your operation.
